NOTE:
-
Times shown are UT (universal time)
unless noted otherwise. Solar North
is up in all the near real time
images.
IMAGE BROWSER
Launch the interactive
browser to learn more about EIT
and MDI images.
Credit: This browser was
developed by Kristian Pontoppidan
Larsen. He is an Applied Physics
Engineer from Denmark and a SOHO fan
who likes to develop web
applications and study the
connection between the sun, weather
and climate.
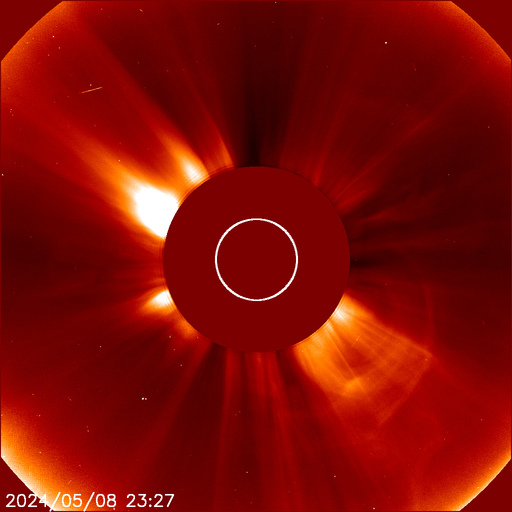
LASCO IMAGES
Images: LASCO C2 (left). LASCO C3
(right).
LASCO (Large Angle Spectrometric
Coronagraph) is able to take images of
the solar corona by blocking the light
coming directly from the Sun with an
occulter disk, creating an artificial
eclipse within the instrument itself.
The position of the solar disk is
indicated in the images by the white
circle. The most prominent feature of
the corona are usually the coronal
streamers, those nearly radial bands
that can be seen both in C2 and C3.
Occasionally, a coronal mass ejection
can be seen being expelled away from the
Sun and crossing the fields of view of
both coronagraphs. The shadow crossing
from the lower left corner to the center
of the image is the support for the
occulter disk.
C2 images show the
inner solar corona up to 8.4 million
kilometers (5.25 million miles) away
from the Sun.
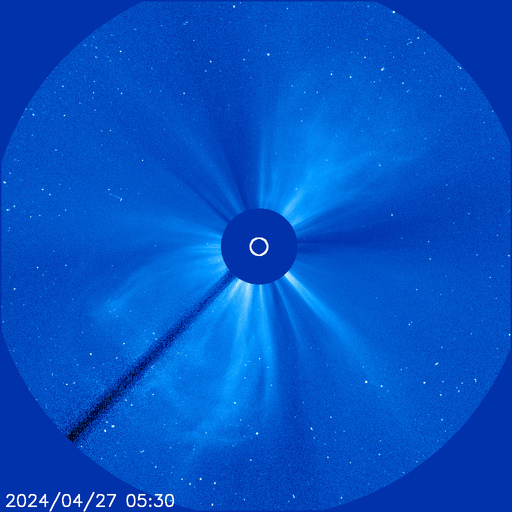
C3 images have a larger
field of view: They encompass 32
diameters of the Sun. To put this in
perspective, the diameter of the images
is 45 million kilometers (about 30
million miles) at the distance of the
Sun, or half of the diameter of the
orbit of Mercury. Many bright stars can
be seen behind the Sun.
NOTE: Observations are almost
continuous but their immediate
availability on the website depends on
having telemetry contact with the
spacecraft via DSN stations.
When there is no telemetry downlink,
observations are recorded on the
spacecraft's solid state recorder. After
the downlink becomes available, we
receive the new observations and those
stored in the recorder.
Once the data is downlinked, there is
an automated process to post the images
on our site in a web-friendly format
(ex. JPG, GIF). It is common that
"missing observations" appear at a later
time. This is because we had to wait for
the telemetry contact to download the
stored data from the spacecraft. The
data in The
Very Latest SOHO images page is
intended just for visual inspection, not
analysis as it is not of science
quality.
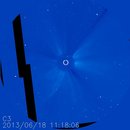
In some occasions, the images have data
gaps caused by transmission errors.
These data gaps appear as black blocks,
superimposed on the images (see image
below). They look particularly bad and
distracting when we generate movies from
these images. To mitigate this, the
automated process posting images on our
site identifies gaps and uses blocks
from a previous image to replace the
missing blocks in the new image.
Data gaps are often corrected upon
re-transmission but this can take some
time. As we are interested in making our
data available immediately for viewing,
we don't want to wait for the
re-transmissions. However, the
re-transmitted science quality data
products are available via the a href="https://sohowww.nascom.nasa.gov/data/archive/">SOHO
Science Archive.
Visit SOHO
Explore! to learn more about the
Sun.
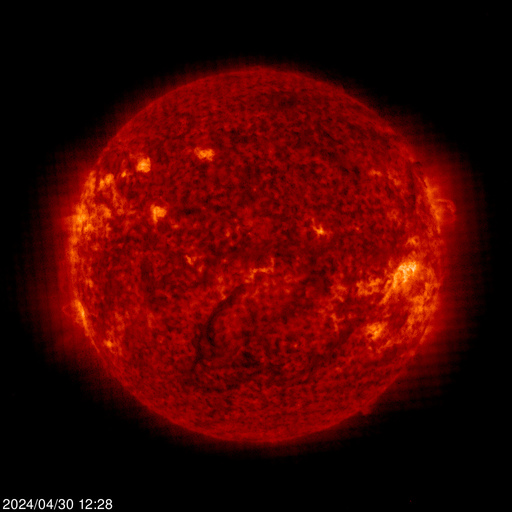
EEIT IMAGES
Images: From left to right: EIT 171, EIT
195, EIT 284, EIT 304/p>
EIT (Extreme ultraviolet Imaging
Telescope) images the solar atmosphere
at several wavelengths, and therefore,
shows solar material at different
temperatures. In the images taken at 304
Angstrom the bright material is at
60,000 to 80,000 degrees Kelvin. In
those taken at 171 Angstrom, at 1
million degrees. 195 Angstrom images
correspond to about 1.5 million Kelvin,
284 Angstrom to 2 million degrees. The
hotter the temperature, the higher you
look in the solar atmosphere.
Visit SOHO
Explore! to learn more about the
Sun.
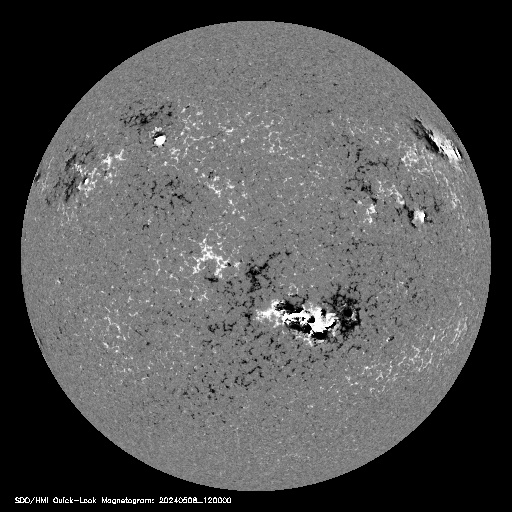
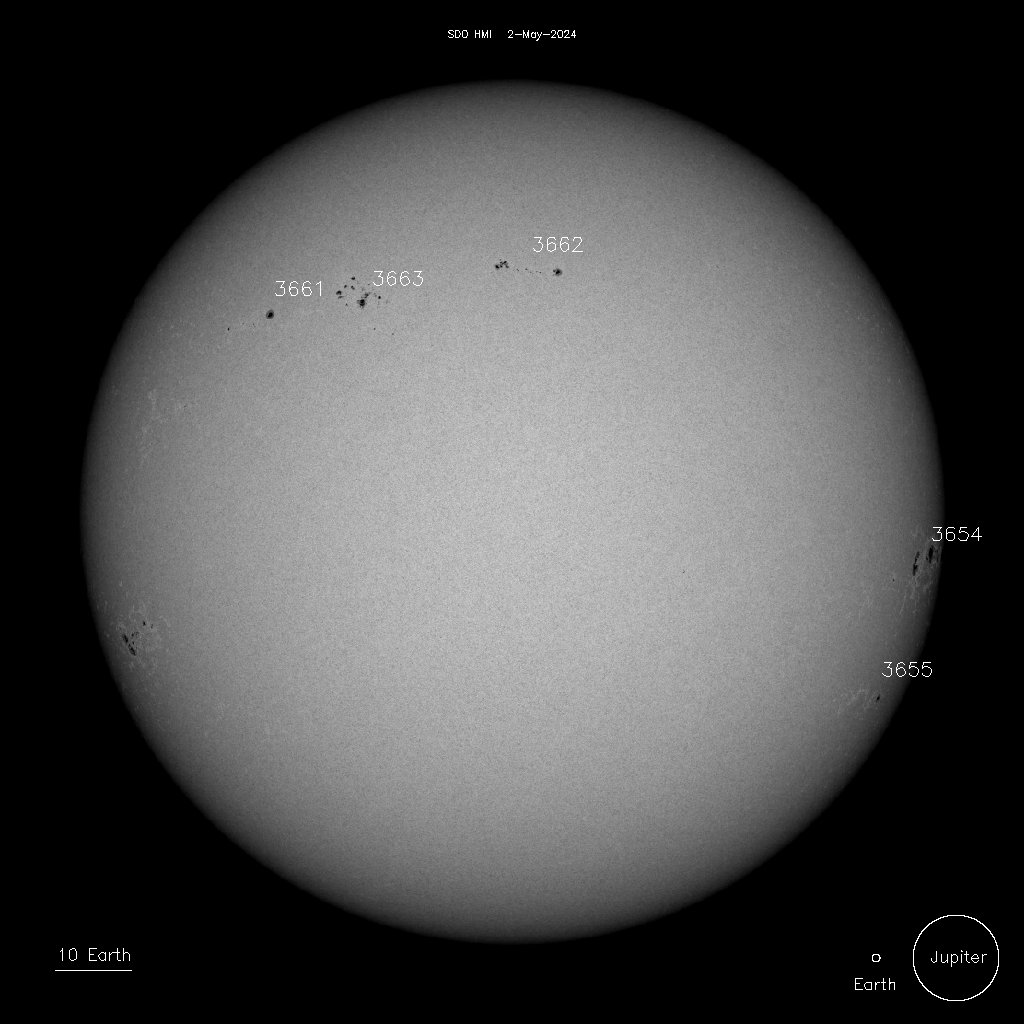
MMDI IMAGES
Images: MDI Continuum (left). MDI
Magnetogram (right)./p>
The MDI (Michelson
Doppler Imager) images shown here are
taken in the continuum near the Ni I
6768 Angstrom line. The most prominent
features are the sunspots. This is very
much how the Sun looks like in the
visible range of the spectrum (for
example, looking at it using special
'eclipse' glasses:Remember, do
not ever look directly at the Sun!).
The magnetogram image shows the magnetic
field in the solar photosphere, with
black and white indicating opposite
polarities.
Visit SOHO
Explore! to learn more about the Sun